I’m no stranger to ‘infograms’.
‘Infograms’, ‘Information graphics’ or ‘infographics’ are graphic visual representations of information, data or knowledge intended to present complex information quickly and clearly
I first met Caroline in the Alzheimer’s Show in London Olympia earlier this year. She is incredibly enthusiastic about the dementia ecosystem – it’s completely genuine and authentic.
This #tweet suddenly appeared out of the blue from Caroline today.
Caroline is at @3SpiritUKNZ.

I had the impossible task of trying to summarise my book in 20 minutes flat for the @AlzheimersShow.
But I feel living well with dementia is essentially about a person who’s received a diagnosis being fully at ease with himself or herself, and equally importantly with the world around him or her.
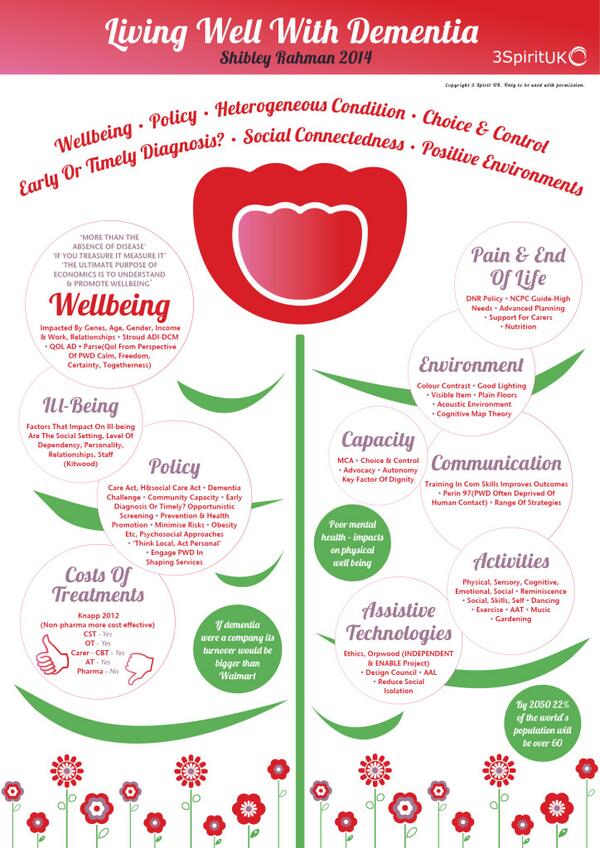

Shibley, This looks like a wonderful graphic and a very helpful book. You have great insight. I love your summary and I am sure that if I could understand your book I would tremendously appreciate it. Aricept brought my reading comprehension up to sixth grade level, and my performance IQ is still high at 119, but I don’t think I would understand much of this book. I’m so glad that Caroline was able to create the wonderful graphic. I have discovered that as a dementia patient graphics are EXTREMELY helpful in my life! — Truthful Loving Kindness (yes it is my full legal name) http://www.truthfulkindness.com